Part of our service to you, our clients is a weekly Google Analytics report to see who is visiting your website, how often and how much time they’re spending on your website. Here’s a run down of how to read your Google Analytics report. For example purposes, this is FreshIdeaWebsites.com Google Analytics report for the first week of 2014.
Section 1) Traffic per day:
This shows how many people visited your site on a particular day. You’ll see a spike on January 6th / 7th. This is a day that we created a new blog post and promoted it on Facebook and twitter. This is a good sign that people were interested in reading about the topic and visited our website to read. You can use this information to determine if there was an increase in traffic from an advertisement you ran or a trade show you participated in for instance.

Section 2) Detailed Visitor Information:
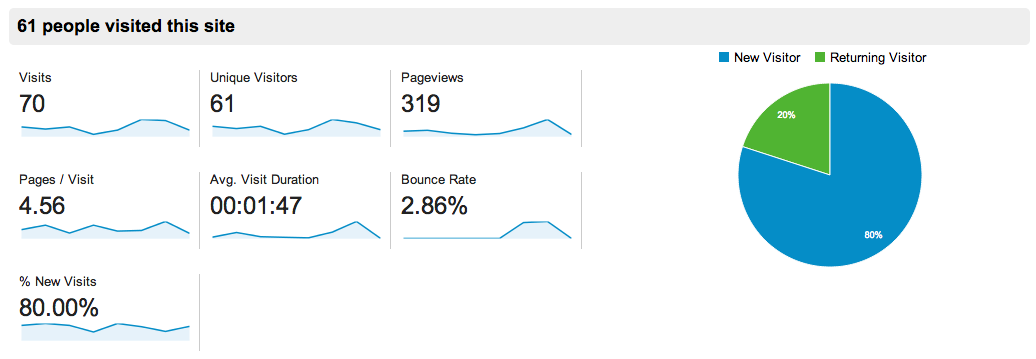
There was 70 visits to the site during that week, and 61 of them were unique visitors (or unique devices). If someone visits on their computer and then their phone, depending on the connection, this usually counts as 2 unique visitors. Between them they visited 319 pages, averaging 4.56 pages / visit (See lower left.)
On the Pie Chart, it shows that 20% of the people who visited the site that week have been to freshideawebsites.com before and 80% came for the first time.
 The Average Visit Duration (Average time someone stayed on the website) is 1 minute, 47 seconds. This combined with the average pages / visit (4.56 in the example above) is important to your Google Search Engine Optimization (Your google rank.) Google likes to see that people are staying on your site for an extended amount of time, and are visiting multiple pages. The logic is that if someone stays on your site for an extended amount of time and visits multiple pages, then your site must be providing useful information they’re looking for, and Google has done their job by providing useful information.
Bounce Rate is the determined by the number of people who visit your site and leave your site from the first page they visit. This also plays into your Google Rank because if someone is coming to your site and then leaving without looking at extra pages, then they may not have found the information they’re looking for. This is often your home page, but not always (for example, if you posted a blog post on Facebook and people clicked that link, the first page they arrive at would be your blog post, rather than your home page.) The goal is to get your bounce rate as low as possible to optimize your rank in Google.
Section 3) Visitor’s Geographical Location:

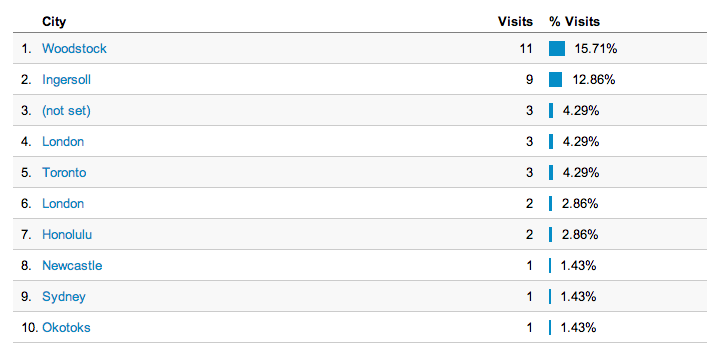
We had a 11 people visit from Woodstock, 9 from Ingersoll, etc. If you look at #3, you’ll see (not set). When you see this in your report, it means that those visitors are logged in with their Google Account and have their privacy settings turned on, so you’ll see very little information related to that visitor. Also, this is based on the geographical location of the Internet Provider, so if someone in Woodstock has internet service from London provider, then that person would show up as “London” even though their computer is sitting in Woodstock. Interestingly, we got visits from Honolulu, Newcastle Sydney, Okotoks… these are possibly referrals from other clients, maybe someone we’ve connected with on Twitter who read a blog post, but most likely a scanning computer that scans websites all over for information to create search ranks for YellowPages, Yahoo, Google or other online directories.
If you’d like to receive Google Analytics reports for your website, and you’re not yet a Fresh Idea client, click here to discuss adding this service onto your website!
